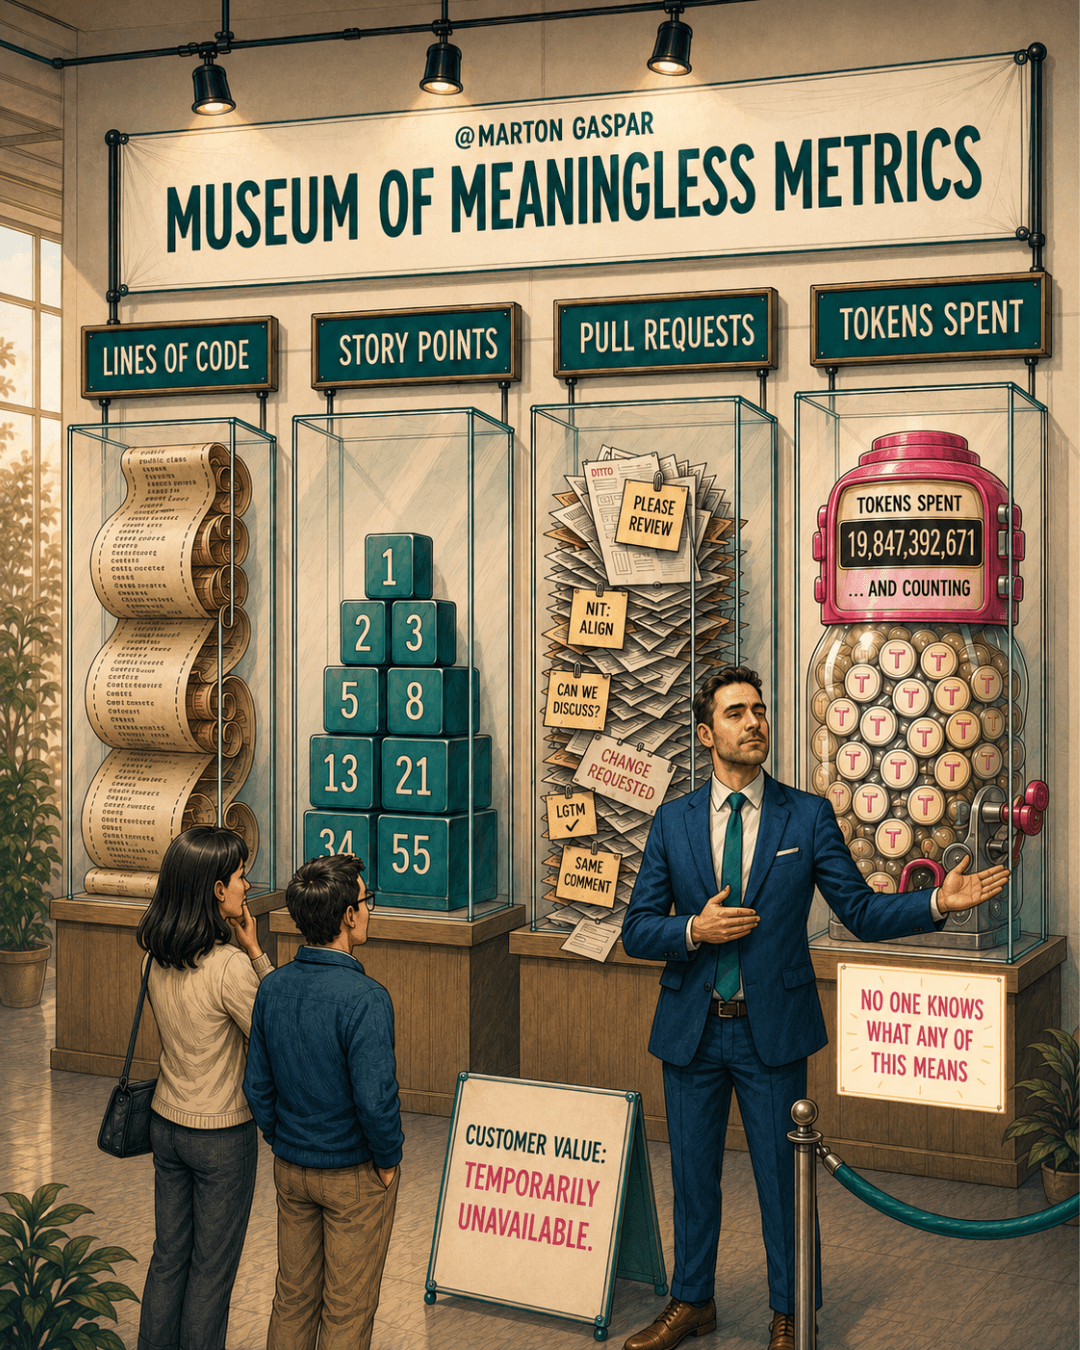
Record-breaking lines of code this quarter. Our proudest number measures nothing.
Walk through the museum. Lines of code, rolled up like an ancient scroll. Story points, stacked in a neat pyramid. Pull requests, piled high with "please review" and "LGTM" notes. Tokens spent, counting past nineteen billion and climbing. A sign by the exhibits says "Customer value: temporarily unavailable", and another admits that no one knows what any of this means.
It isn't only code. It's every number a team reports with pride. Look closely and each one is a build number. Not one of them is a customer outcome. This page explains the difference, why AI made it urgent, and the single question that sorts a useful metric from a museum piece.
Build numbers and customer numbers
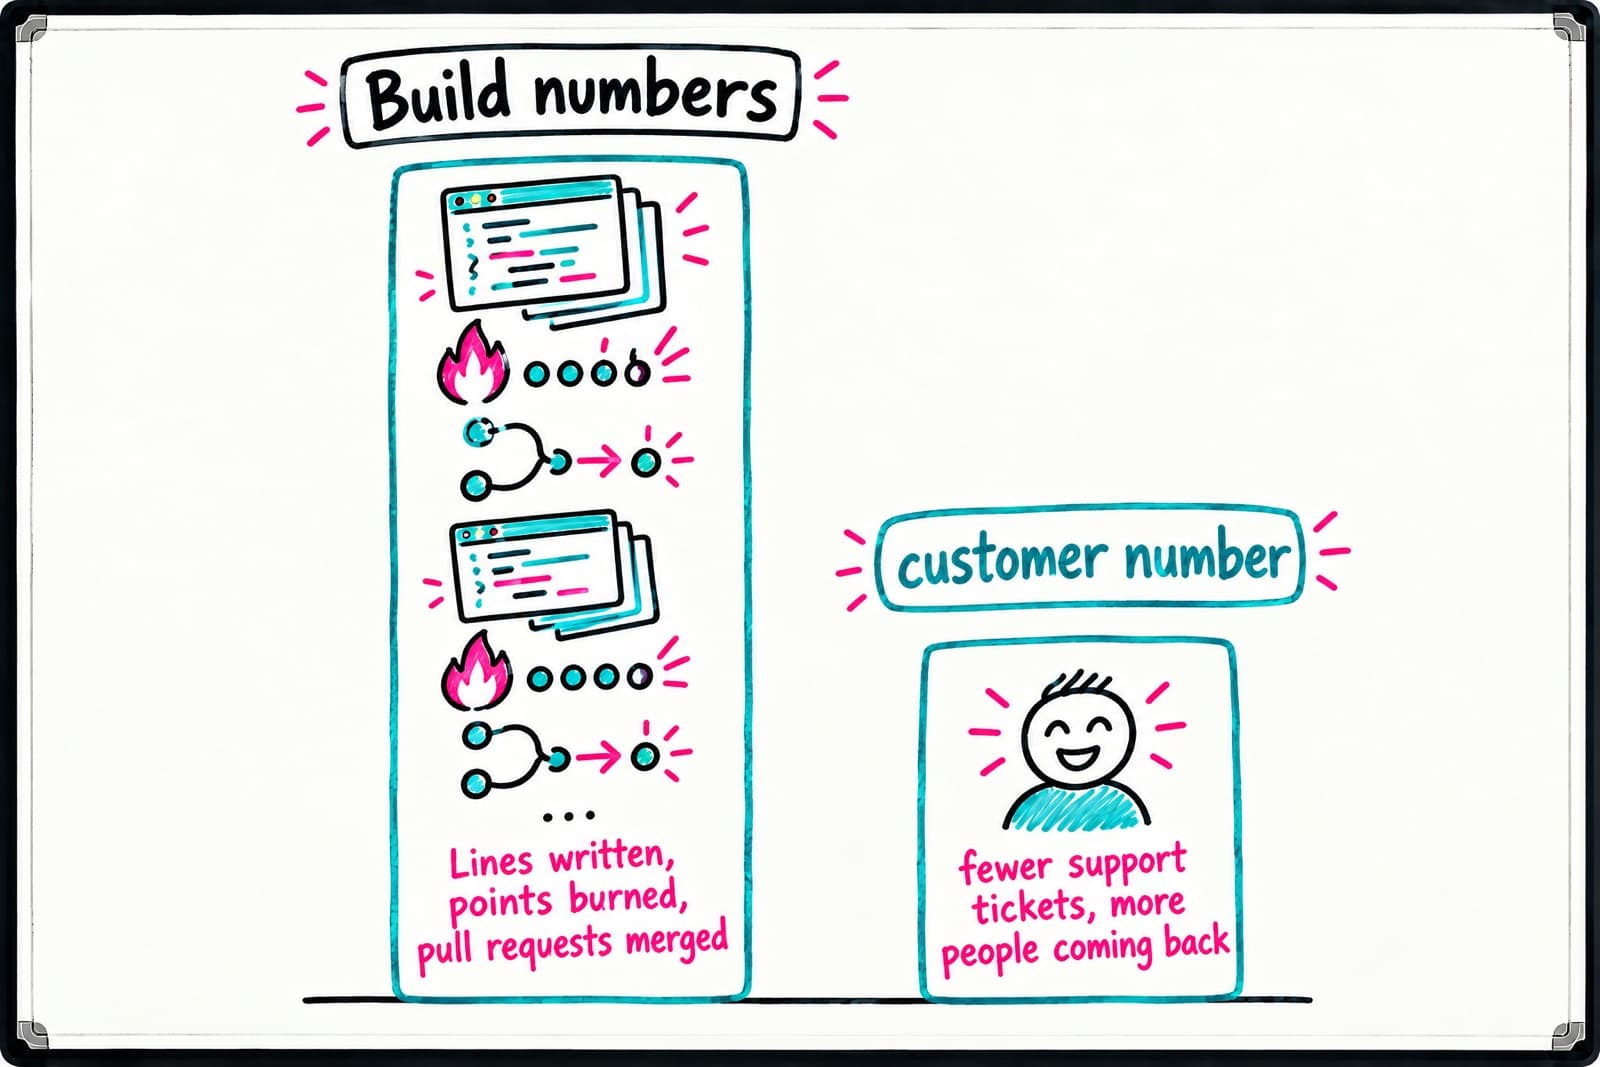
A build number tells you the team was busy. Lines written, points burned, pull requests merged, tokens consumed, tickets closed. These measure effort and activity. They're real, and they're useful for running the work.
A customer number tells you someone's life got easier. Tasks completed faster, fewer support tickets, more people coming back, renewals, money saved. These measure whether the effort changed anything for the people you build for.
The two are easy to confuse because they move together when things go well. Ship more, and usually something improves for customers. But they come apart all the time, and when they do, only the customer number tells the truth.
The four exhibits, and what each one hides
Lines of code is the oldest exhibit. It feels like progress because it's tangible. But more code often means more to maintain, and the best change to a product is sometimes deleting something. A team can write its record quarter and leave customers exactly where they were.
Story points look like a measure of delivery. They're an estimate of effort, agreed by the team doing the work, so they rise whenever estimates drift upwards. They help a team plan. They say nothing about whether the work was worth doing.
Pull requests count how often code changed hands. A pile of them can mean a healthy flow of small changes, or a lot of review comments going round in circles. Either way, the customer never sees a pull request.
Tokens spent is the newest exhibit, and it counts the fuel, not the journey. A rising token count proves the team is using AI. It doesn't prove the AI produced anything a customer wanted.
Why AI turned the museum into a problem
AI made building almost free. So every build number is now climbing fast. A team with good AI tools can double its lines of code, its pull requests and its story points without a single customer noticing a difference.
That's the tell. A number AI can inflate on its own was never measuring value. If a model can push a metric up while the product stays the same, the metric was measuring the cost of building, not the result of it.
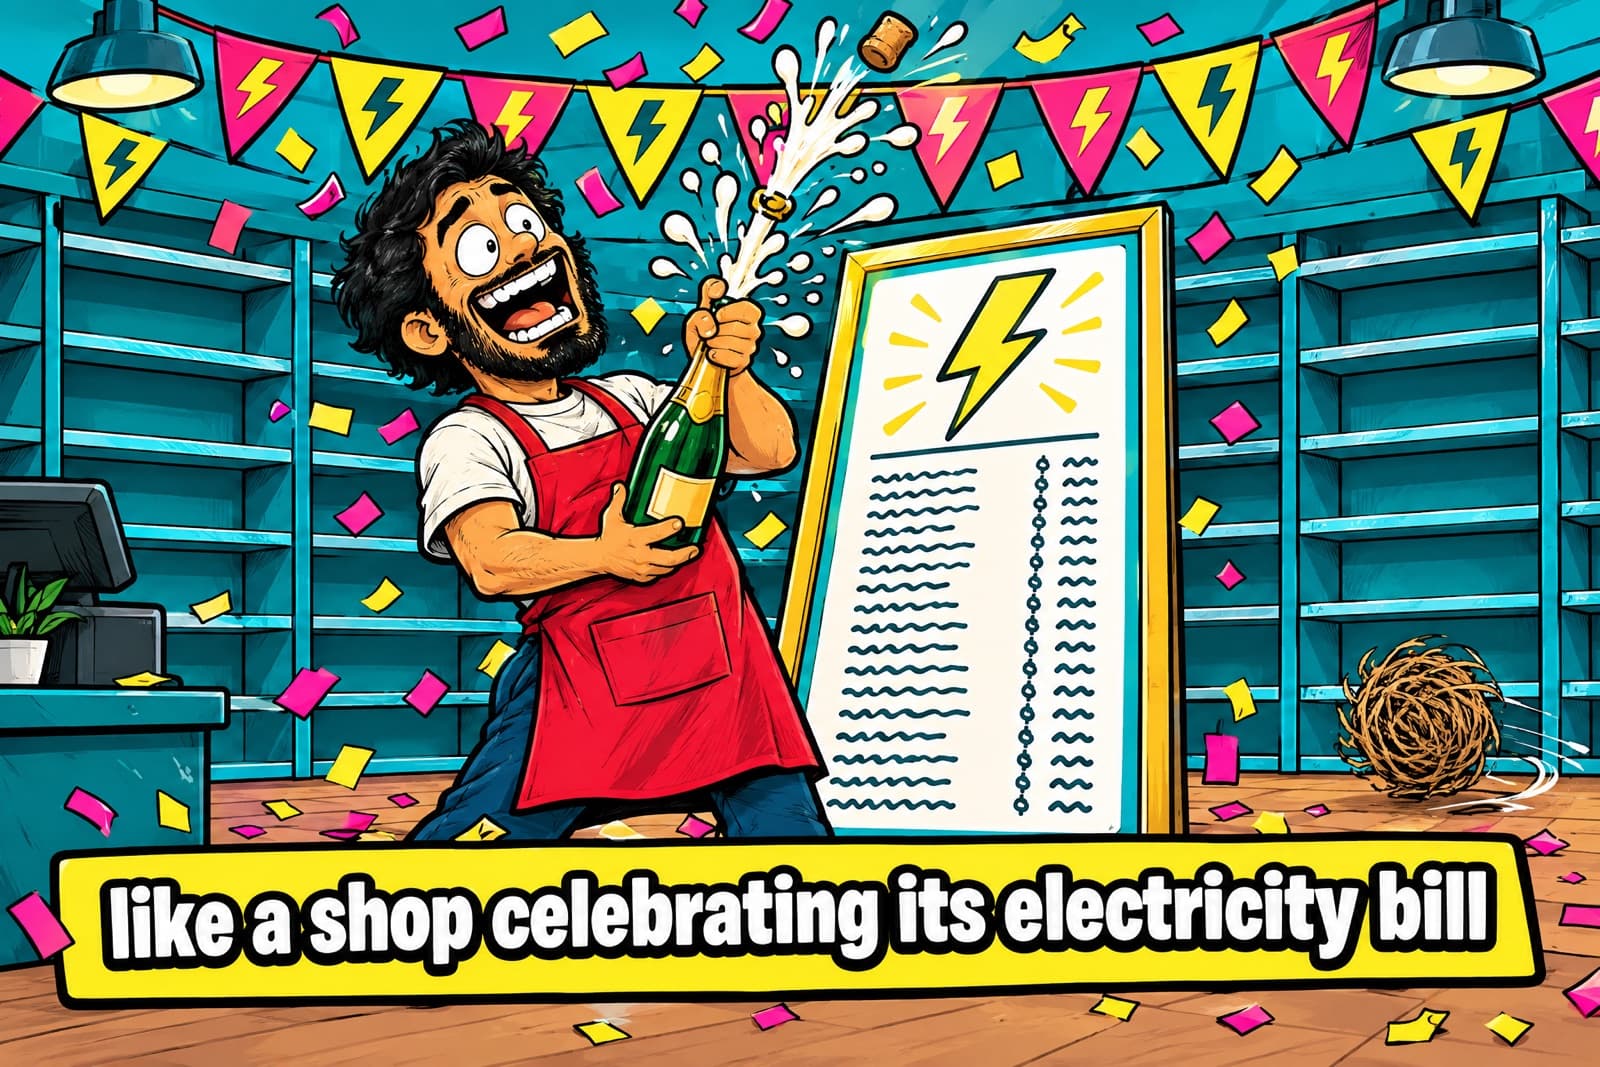
It's tempting to report AI usage as proof of progress. But tokens are a cost line. Celebrating them is like a shop celebrating its electricity bill.
Why the dashboard becomes a hiding place
Busy is easy to count. Better is hard. Better is also scarier, because the customer number can tell you that you were wrong. You shipped the feature, and nothing changed. That's uncomfortable to put on a slide.
Output can never deliver that message. Lines of code always go up when people write code. So a dashboard full of build numbers is a safe place to stand. Every number is green, every chart points up, and none of them can embarrass anyone.
That's exactly why the customer number goes missing. A full dashboard of output feels like accountability while avoiding the one measure that could hurt.
The one question to ask of every number
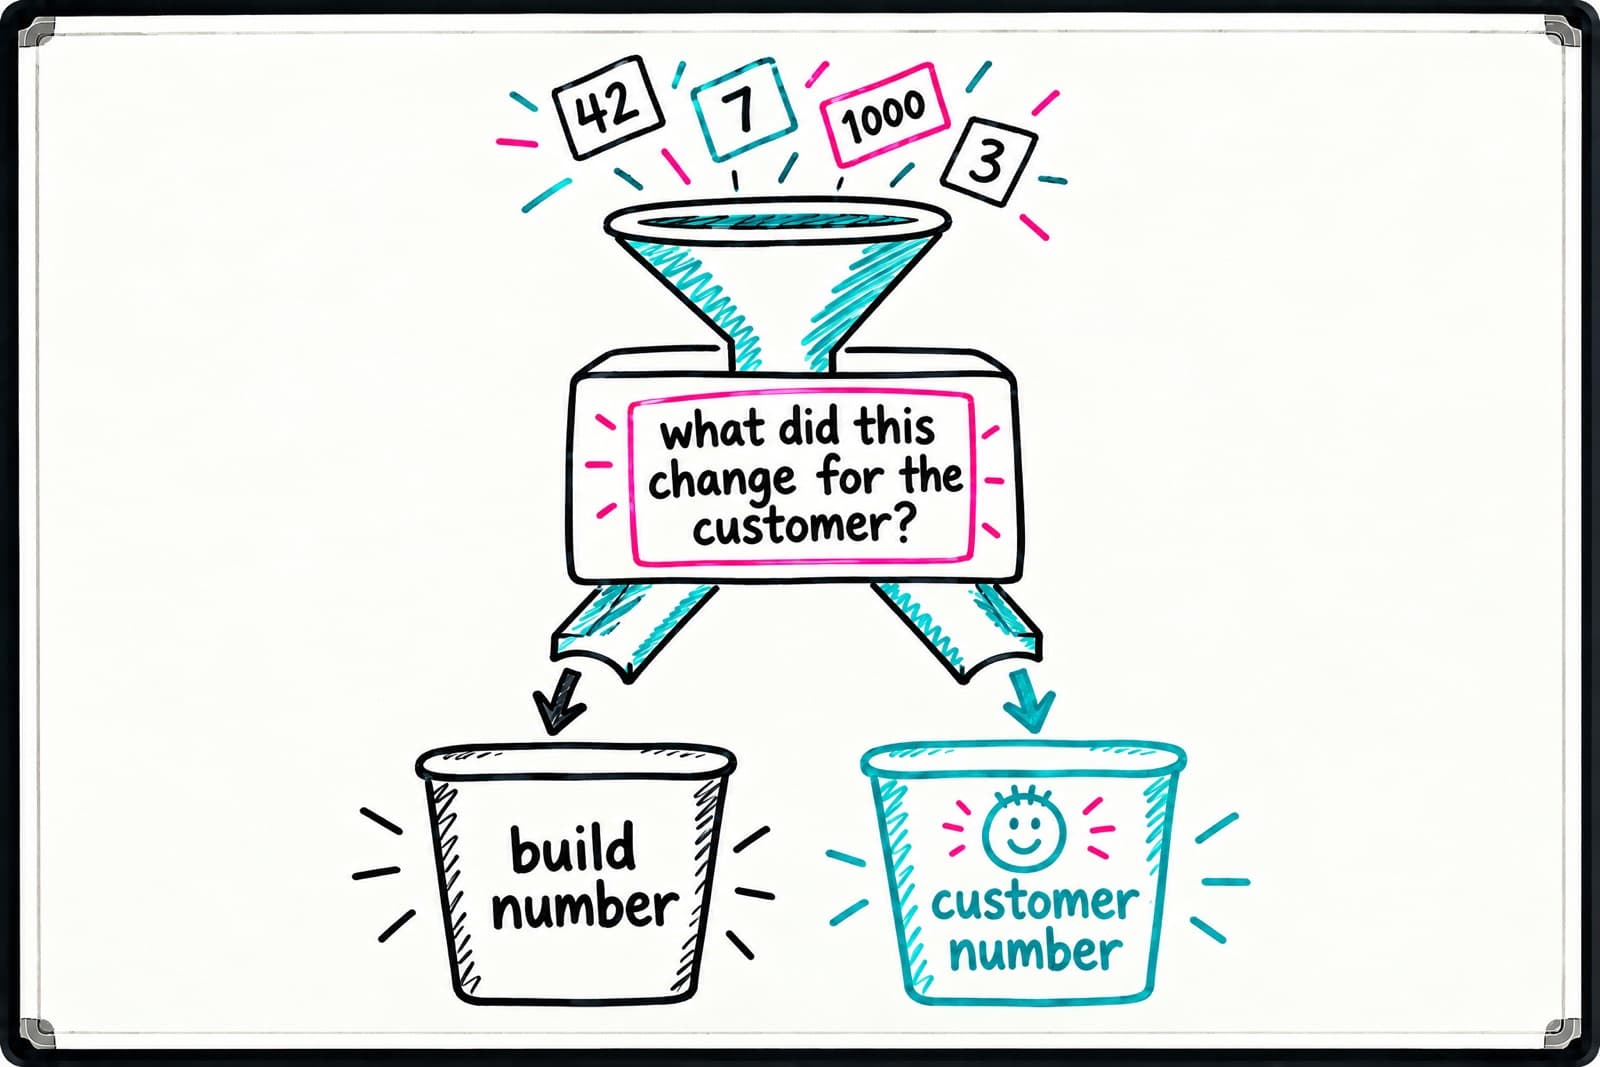
Ask one question of every number you report: what did this change for the customer?
If the answer is "nothing yet", it's a build number. That doesn't make it useless. Build numbers help you plan capacity, spot bottlenecks and run delivery. They're necessary. They're still not the point.
If the answer names a real change, such as people finishing a task in half the steps or calling support less often, you've found a customer number. Put that one at the top of the report, and let the build numbers sit underneath as the explanation.
How to rebuild your dashboard
Start with the report you already send. Go through each metric and label it build or customer. Expect the build column to be long and the customer column to be short, or empty.
Then, for each important piece of work, name the customer behaviour it should change before it starts. Not "ship the new onboarding", but "more new users complete their first project in week one". That gives you a customer number to check after launch.
Finally, change the order. Lead with the customer numbers, even when they're flat or down. A flat customer number with a plan is more useful to leadership than a wall of rising build numbers with no story.
Don't mistake the museum for the product
Ship the code. Burn the tokens. Fill the board. None of that is wrong. Just don't mistake the museum for the product.
The museum image was inspired by Itamar Gilad, whose work is worth following if this topic matters to you. The PDF has the full illustration, so you can put it in front of your team next time the dashboard review starts.